writing
Messier: Tracing Objective-C Method CallsMessier - 简单易用的 Objective-C 方法跟踪工具
· Building tools & products
Translated from Chinese — .
On this page
Messier can be used to trace Objective-C method calls in iOS apps. On a jailbroken device you can trace any app, and on a non-jailbroken device you can also use it to trace an app you are debugging.
Background
In most cases, using Instruments (mainly the Time Profiler) for performance analysis of iOS apps is good enough. But the Time Profiler merges method calls together, losing the temporal (timing) representation. Then one day I saw an Android colleague using systrace for performance analysis. systrace generates an HTML file that shows the time cost of functions (methods) in chronological order. I thought to myself: it would be great if iOS had a tool like this. I learned that this HTML file is generated by catapult.
One day I saw a post on the iosre forum about hooking objc_msgSend. It suddenly occurred to me that I could combine catapult to generate a performance analysis chart for Objective-C methods (let’s call it that for now). (Although there had always been ways to hook objc_msgSend, this time I finally couldn’t resist digging into this well-cooked dish.)
So after some effort, AppleTrace was born in September 2017. While using AppleTrace, I wrote four articles introducing it:
- AppleTrace Performance Analysis Tool
- AppleTrace with MonkeyDev to Trace Any App
- Installing the AppleTrace Tweak with Cydia
- Exploring SpringBoard with AppleTrace
While using AppleTrace, I felt it still wasn’t simple and easy enough, especially:
- You couldn’t visually define start and end points. For example, start tracing before tapping a button, and stop tracing after the button tap completes.
- Getting the trace file was too cumbersome. You had to manually copy it out of the sandbox, then run merge.py, then run trace2html (optional), and finally open the trace file.
When the work only requires tracing one app, AppleTrace pretty much met the requirements. However, as curiosity grows and you want to look at more and more apps, the tedious “manual” operations become a bit of a hassle.
Messier Is Born
To solve AppleTrace’s usability problems, I developed the Messier app on top of AppleTrace (official website https://messier-app.github.io/). With Messier you can conveniently trace any app on a jailbroken device, and customize the trace start and end points visually more easily.
Messier consists of three parts.
- Tweak (jailbreak plugin)
- Dylib (dynamic library messier.framework)
- Desktop client (Messier.dmg)
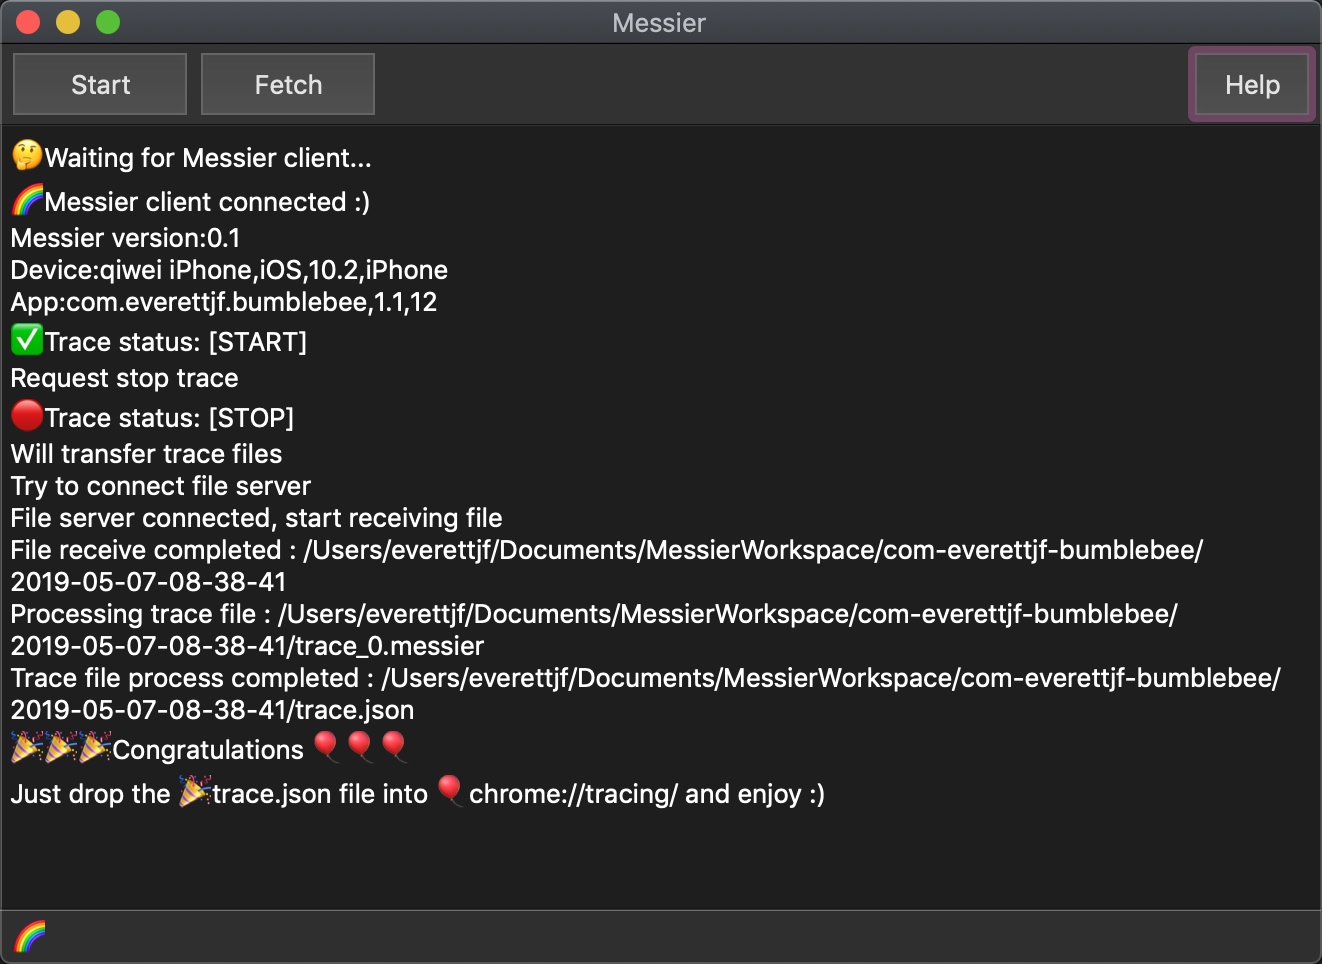
Below are some screenshots:
Latest Build
Download the latest build files here.
How to Use
Step 1: Install the macOS Client
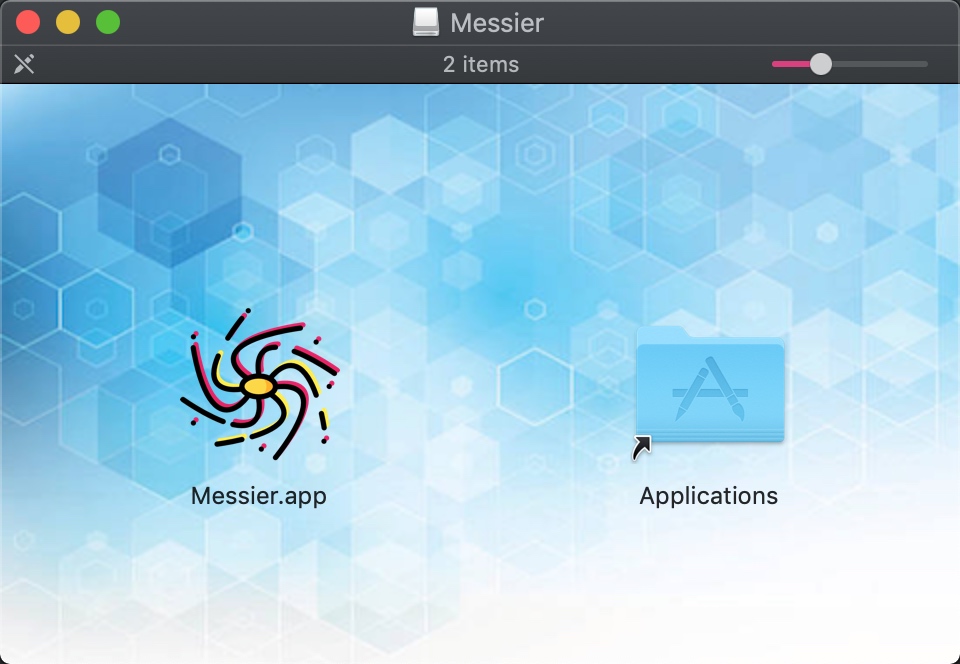
Download and install the latest macOS client Messier.dmg from here.
Step 2: Jailbroken Device Configuration
(1) Installation
- Open
Cydia. - Tap
Sources->Edit->Add. - Enter
https://messier-app.github.io/cydia, then tapAdd Source. After reloading you will seeMessier Repo. - Go into
Messier Repoand install theMessierTweak. (Note: the Messier tweak depends onPreferenceLoaderandAppList, so make sure those two Tweaks are installed first.)
(2) Configuration
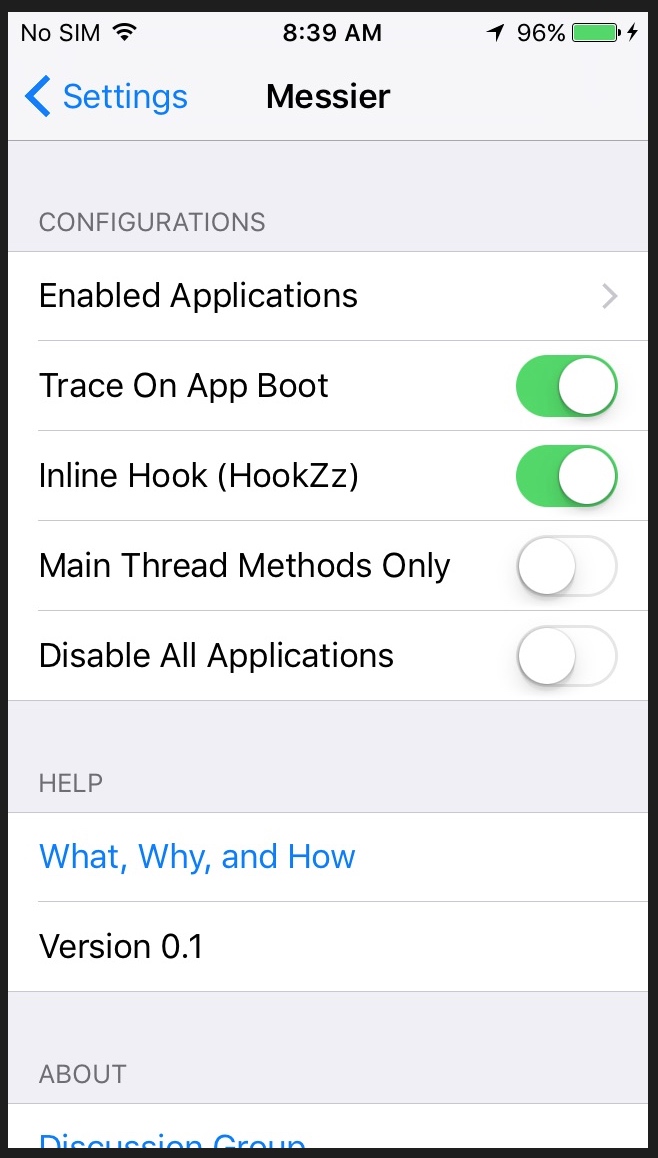
Open the system Settings and scroll down to find Messier (under Developer). Tap to enter and start configuring, as shown below.
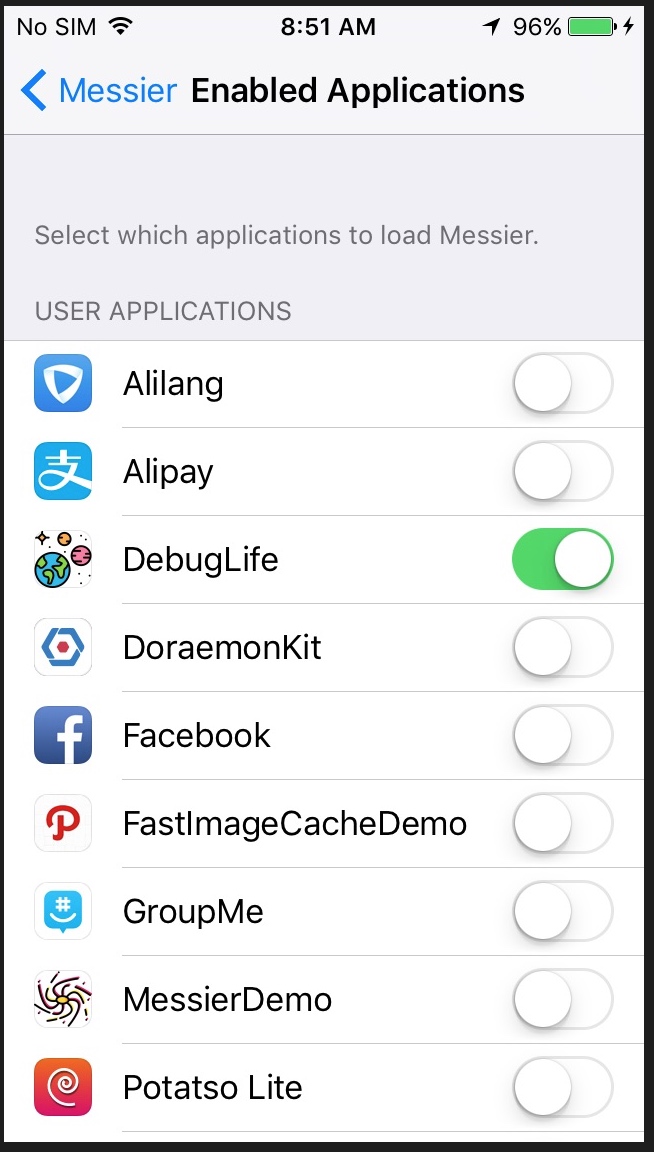
When Enabled Applications is turned on, it looks like the image below. You can set the apps you want to trace.
Trace On App Boot configures whether to start recording methods at app launch. Enabled by default.
Inline Hook (HookZz) configures whether to use Inline Hook. Enabled by default. Inline Hook is implemented using HookZz.
Main Thread Methods Only configures whether to record only method calls on the main thread. Disabled by default.
Disable App Applications configures whether to disable method recording for all apps. Disabled by default. If enabled, the Enabled Applications configuration will have no effect.
Step 2: Non-Jailbroken Device Configuration
Non-jailbroken usage means working in an environment with your own source code or MonkeyDev, and requires configuring the Xcode project.
Note: first of all, Messier only supports arm64 at the moment, so you can only use an arm64 real device.
Download and unzip from here to get messier.framework.
- Drag
messier.frameworkintoXcode Targets->Build Phases->Link Binary With Libraries. - Click
New Copy Files Phaseto add aCopy Filesstep, dragmessier.frameworkinto it, and setDestinationtoFrameworks.
Configure as shown below:
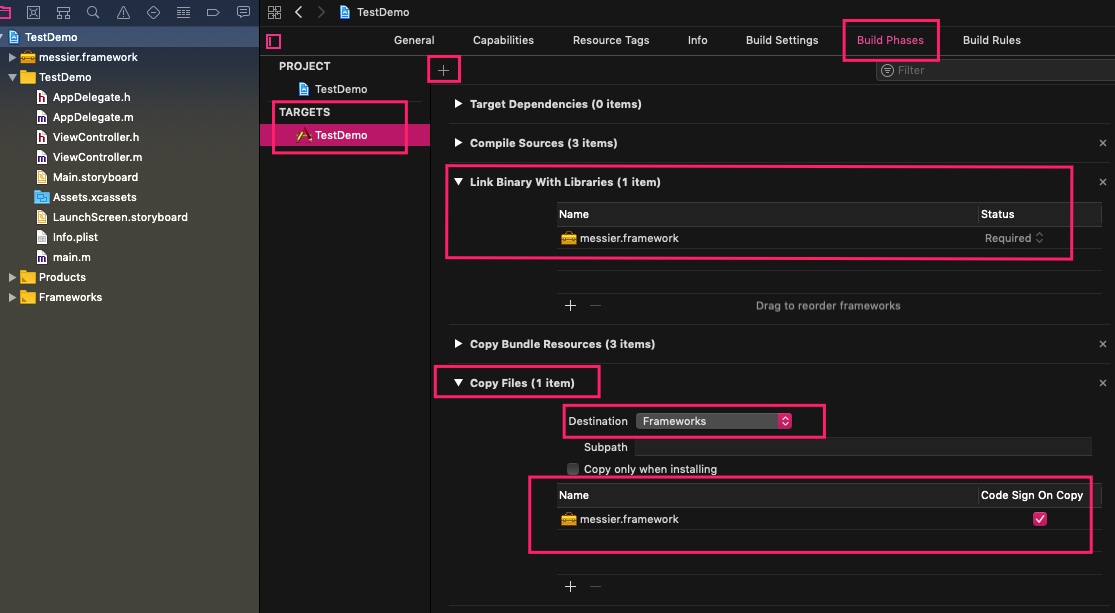
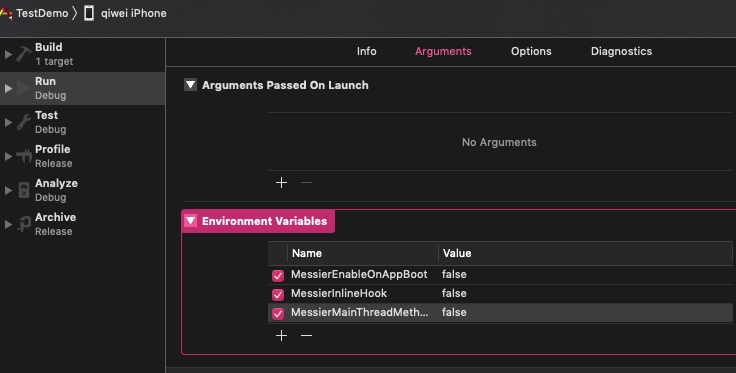
In this case, if you need to do some parameter configuration, you can go to Project Scheme -> Run -> Arguments and set Environment Variables.
MessierEnableOnAppBoot : true | false
MessierMainThreadMethodsOnly : true | false
For example:
Step 3: Start Tracing
Open the macOS client. It will prompt that it is waiting for a connection, as shown below:
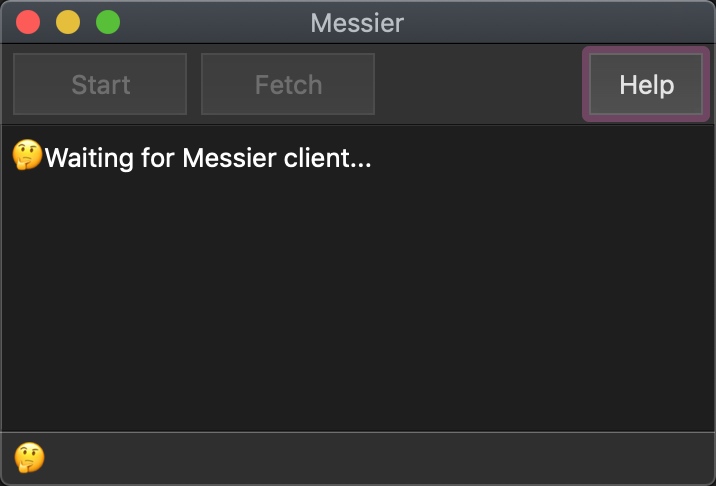
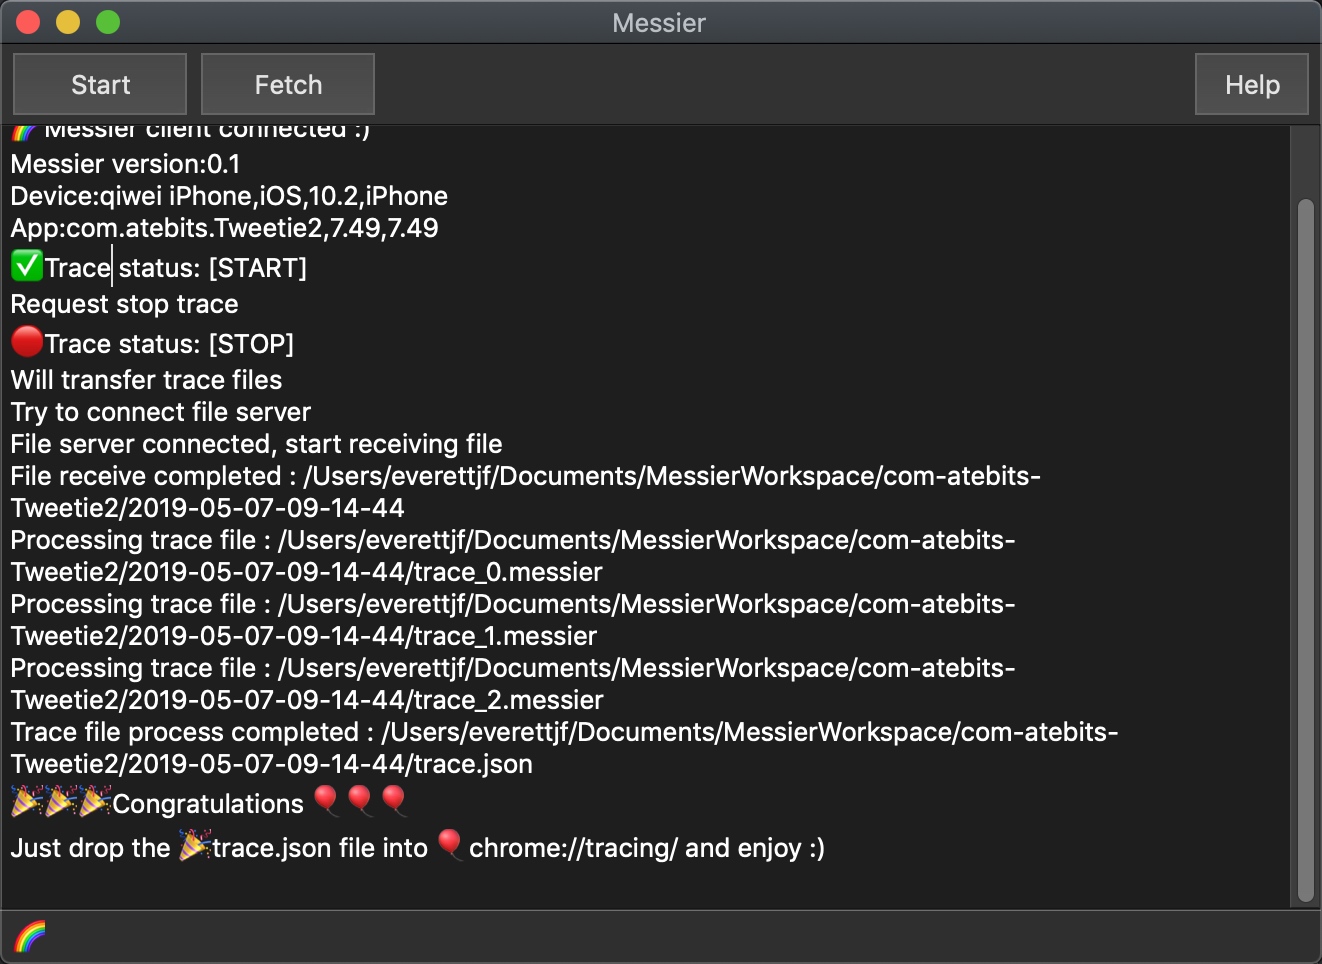
Use a USB cable to connect the iPhone and the Mac, and open the app you have configured to trace. If you're lucky, the app won't crash, and the macOS client will show as connected. (If you’re unlucky and the app crashes, you can disable InlineHook as described in the configuration above.)
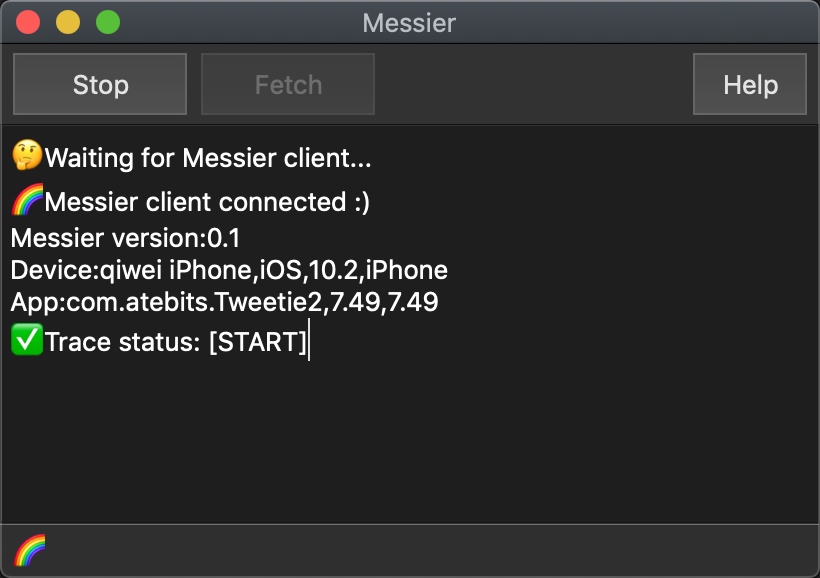
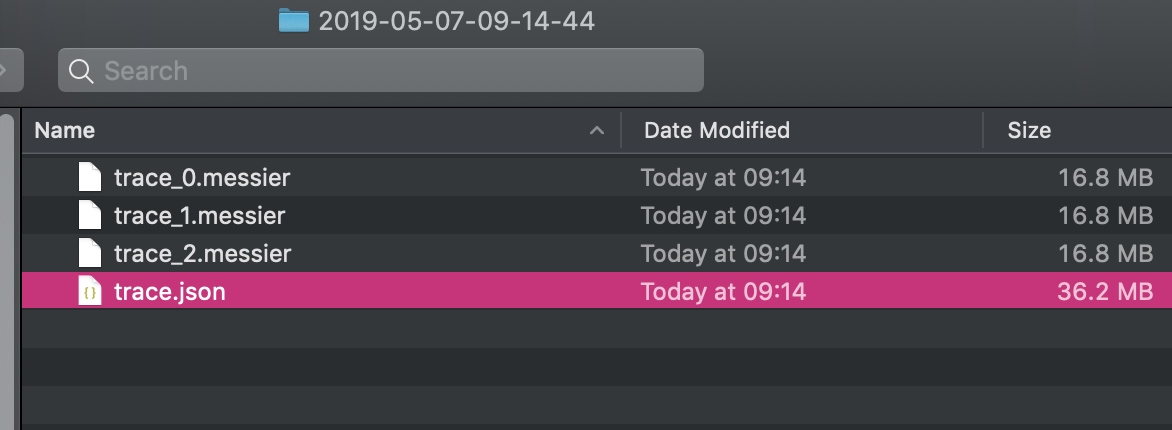
When tracing is finished, click Stop, then click Fetch. If you’re lucky, after some file transfer, Finder will locate the trace.json file, as shown below:
Step 4: View the Results
Open Chrome browser (or a Chromium-based browser) and go to chrome://tracing.
Drag in the trace.json produced in the previous step.
A wonderful result is born.
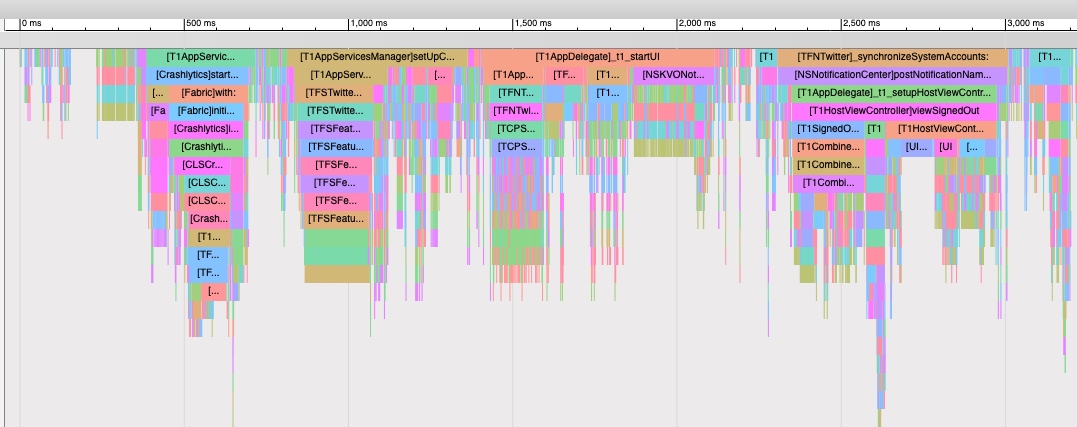
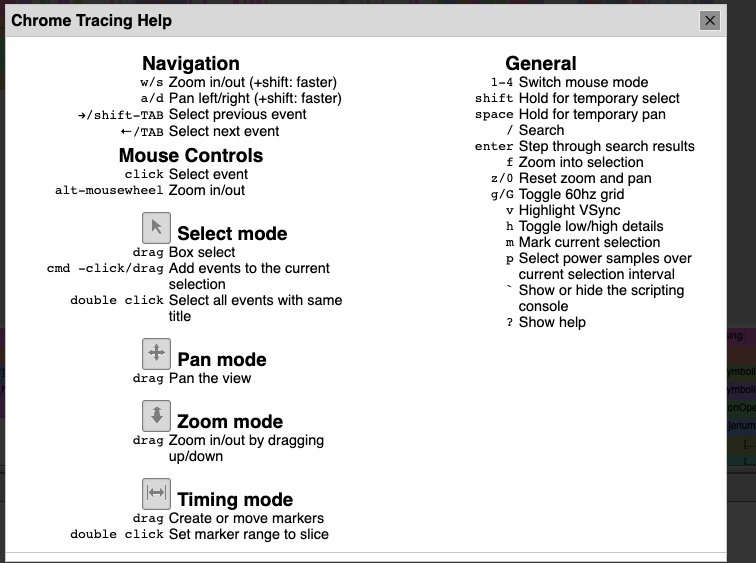
Now you can use w a s d to browse this file. For detailed usage, click the question mark in the top-right corner, as shown:
Support
In theory, it currently supports systems >= iOS 10.
I have only tested tracing on a few apps on iOS 10 and iOS 12. If you run into any problems, feel free to report them anytime.
Update: iOS 14 also works
Open Source and Licensing
Open Source
Messier is free but closed source. The core of Messier is still AppleTrace, so the core is still open source. Besides that, I also want to thank the following three repos.
Licensing
The pricing and access details in this release post describe the 2019 release. Refer to the project’s own documentation for its current terms.
Summary
Developing any software is a hard process. Once the core feature is there, you still have to write a lot of supporting infrastructure code to make that core easier to use. Developing Messier this time gave me deep feelings about this. For a lot of software, going from usable to easy to use really takes a lot more effort. Going from 0 to 1 is hard; going from 1 to 100 is even harder.
Once again, here’s Messier’s official website: https://messier-app.github.io/
Thank you for reading :)
文章目录
Messier 可以用来跟踪iOS应用的Objective-C方法调用。在越狱设备上可以跟踪任意应用,在非越狱设备上也可用于跟踪调试中的应用。
背景
一般情况下使用Instruments(主要是Time Profiler)进行iOS 应用的性能分析就足够了,但是Time Profiler 把调用方法都合并了起来,失去了时序的表现。直到有一天看到Android开发的同事使用 systrace 分析性能,systrace生成一个html文件,把函数(方法)的调用耗时按照先后顺序表现出来。心里想:要是iOS也有这样的工具就好了。了解到这个html文件是 catapult 生成的。
一天看到iosre论坛一篇hook objc_msgSend的帖子。突然想到,可以结合catapult来生成Objective C方法的性能分析图(暂且这么叫吧)。(虽然一直也有hook objc_msgSend的方法,但这次煮好的佳肴终于忍不住下手了)。
于是经过一番努力,AppleTrace 于2017年9月份诞生了。在使用AppleTrace的过程中,我曾经写过四篇文章介绍他:
- AppleTrace 性能分析工具
- AppleTrace 搭配 MonkeyDev Trace任意App
- 使用 Cydia 安装 AppleTrace Tweak
- 使用AppleTrace探索SpringBoard
在使用AppleTrace的过程中,感受到AppleTrace还不够简单易用,尤其是:
- 不能在视觉感受上定义开始和结束点。例如点击某个按钮之前开始Trace,按钮点击完成后停止Trace。
- 获取trace文件太麻烦,需要手动从沙盒复制出来,然后执行merge.py,再执行trace2html(可选),最后打开trace文件。
当工作只需要Trace某一个应用时,AppleTrace几乎满足了要求,然而当好奇心增强,想看越来越多的应用时,啰嗦的“手动”操作就有点麻烦了。
Messier 诞生
为了解决AppleTrace的易用性问题,我在AppleTrace的基础上开发了Messier应用(官方网站 https://messier-app.github.io/)。使用Messier可以方便的在越狱设备上Trace任意应用,且能更方便的在视觉上自定义Trace的开始点和结束点。
Messier由三个部分组成。
- Tweak(越狱插件)
- Dylib(动态库 messier.framework)
- 桌面端(Messier.dmg)
下面是相关截图:
最新Build
使用方法
第一步,安装macOS客户端
在这里 下载安装最新的macOS客户端 Messier.dmg。
第二步,越狱设备配置
(1)安装
- 打开
Cydia. - 点击
Sources->Edit->Add. - 输入
https://messier-app.github.io/cydia, 点击Add Source. 重新加载后会看到Messier Repo. - 进入
Messier Repo, 安装TweakMessier. (注意:Messier tweak 依赖PreferenceLoader和AppList,所以需要先确保这两个Tweak已经安装)
(2)配置
打开系统的设置,向下滑动可以看见Messier(Developer下面),点击进入即可开始配置,如下图。
Enabled Applications 打开后如下图,可设置需要Trace的应用。
Trace On App Boot 配置是否在应用启动时就开始记录方法,默认启用。
Inline Hook (HookZz) 是否使用Inline Hook,默认启用。Inline Hook使用了HookZz来完成。
Main Thread Methods Only 是否只记录主现场的方法调用,默认关闭。
Disable App Applications 是否关闭所有应用的方法记录,默认关闭。若启用后,Enabled Applications的配置将失效。
第二步,非越狱设备配置
非越狱使用,就是在由自己源码或者MonkeyDev的环境下进行,需要对Xcode工程配置。
注意:首先要说明的是,目前Messier只支持arm64,因此只能使用arm64的真机。
在这里 下载解压后得到messier.framework。
- 拖拽
messier.framework到Xcode Targets->Build Phases->Link Binary With Libraries. - 点击
New Copy Files Phase添加Copy Files步骤, 拖拽messier.framework进去 ,配置Destination为Frameworks.
如下图配置:
这种情况下如果需要进行一些参数配置,可以在 Project Scheme -> Run -> Arguments, 设置 Environment Variables。
MessierEnableOnAppBoot : true | false
MessierMainThreadMethodsOnly : true | false
例如:
第三步,开始Trace
打开macOS客户端,此时会提示等待连接,如下图:
使用USB连接线连接iPhone和Mac电脑,打开配置好的要Trace的应用,运气好的话,应用不会Crash,并且macOS客户端会显示已经连接。(如果运气不好,应用Crash了,可以按照上文配置中的说明,关闭InlineHook)
当Trace结束,点击Stop,然后点击Fetch,如果运气好的话,一番文件传输后,会使用Finder定位到trace.json文件,如下图:
第四步,查看结果
打开Chrome浏览器(或者Chromium系列),进入chrome://tracing。
把上一步产生的trace.json拖拽进去。
奇妙的结果诞生了。
此时,可以使用w a s d 来浏览这个文件了。详细使用方法可以点右上角的问好,如图:
支持
目前理论上支持 >= iOS10 的系统。
我只是测试了iOS10和iOS12的少部分应用的Trace,如果遇到问题,大家随时反馈。
补充:iOS14也可使用
开源和授权
开源
Messier是免费但闭源的。Messier的核心仍然是AppleTrace,因此核心仍然是开源的。除此之外,还要感谢以下三个仓库。
授权
本文中的价格与使用方式记录的是 2019 年发布时的情况。当前使用条件请以项目自身的说明为准。
总结
任何软件的开发都是个艰辛的过程,核心功能有了,但为了更容易的使用这个核心,周边的辅助设施代码要写很多。此次开发Messier让我感触颇深。很多软件,能用 到 好用 真的是还要努力很多。 从0到1难,从1到100更难。
再次附上Messier的官方网站: https://messier-app.github.io/
Thank you for reading :)