writing
Exploring SpringBoard with AppleTrace使用 AppleTrace 探索 SpringBoard
· Debugging & reverse engineering
Translated from Chinese — .
On this page
A while ago, “A First Look at LaunchScreen” used IDA and lldb to explore part of SpringBoard. This article takes another preliminary look at SpringBoard, this time with AppleTrace. AppleTrace currently uses HookZz to inline-hook objc_msgSend. It can be used to analyze the time spent in each Objective-C method, and the call relationships.
Background
AppleTrace is a “performance” analysis tool I developed (or rather, assembled) in my spare time around September last year (2017). “Performance” is in quotes because, although the original intent was to use it for performance analysis, its impact on performance is fairly large, so it can only be used as a reference. Or you could say it can be used to analyze the relative time spent between methods.
I’ve written three articles before:
- AppleTrace performance analysis tool: https://xnu.app/2017/09/21/appletrace/
- AppleTrace combined with MonkeyDev to trace any app: https://xnu.app/2017/10/12/appletrace-dancewith-monkeydev/
- Installing the AppleTrace Tweak via Cydia: https://xnu.app/2018/07/10/appletrace-tweak-cydia-repo/
Wow, I’ve actually written three articles — AppleTrace really can pad out the count.
A while ago, “A First Look at LaunchScreen” used IDA and lldb to explore part of SpringBoard. This article gives a very simple introduction to how to use AppleTrace to explore SpringBoard.
The address is: https://github.com/everettjf/AppleTrace.
Of course, the reason I’m writing this article is that AppleTrace had always kept catapult and hookzz as submodules. But because the catapult repo is too large, the first download and switching branches took too long; and hookzz’s interface changed too frequently, so I had to modify my code every time I updated hookzz. So today I deleted both submodules, found a usable copy of the hookzz code, and put it directly into the repo.
How to Do It
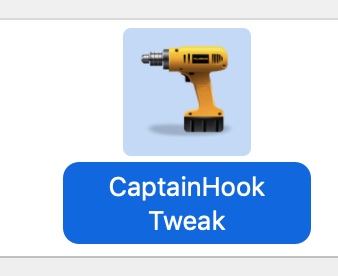
- Use MonkeyDev to create a Tweak project (e.g. CaptainHookTweak)
- Drag in the
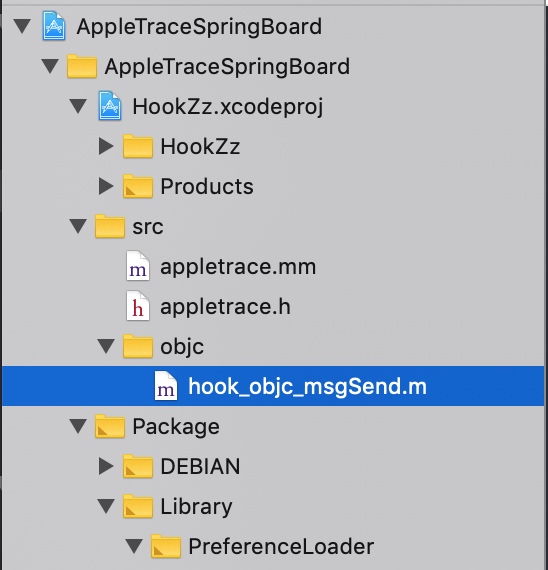
objc_msgSendhook-related files from AppleTrace
-
After configuring the IP address, cmd+r will install it onto your jailbroken phone.
-
After SpringBoard restarts, it will automatically record all Objective-C method calls.
-
Open the directory
/var/mobile/Library/appletracedata. Due to the special permissions of SpringBoard, getting to the Library directory location ended up here.
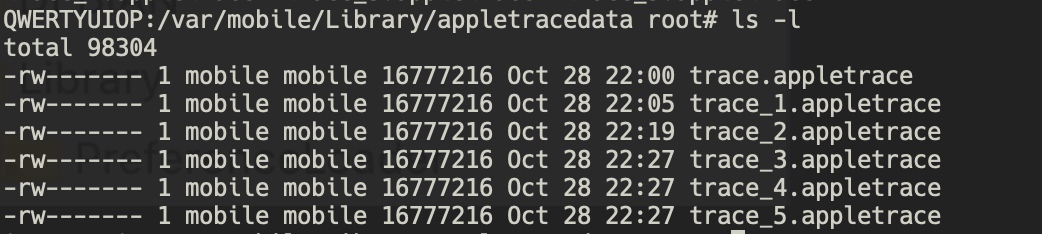
- Copy out these files.
There are many ways to copy. For example, you can tar -zcvf x.tar.gz appletracedata/ and then scp them out.
- Use AppleTrace’s merge.py script to process them into a
trace.jsonfile.
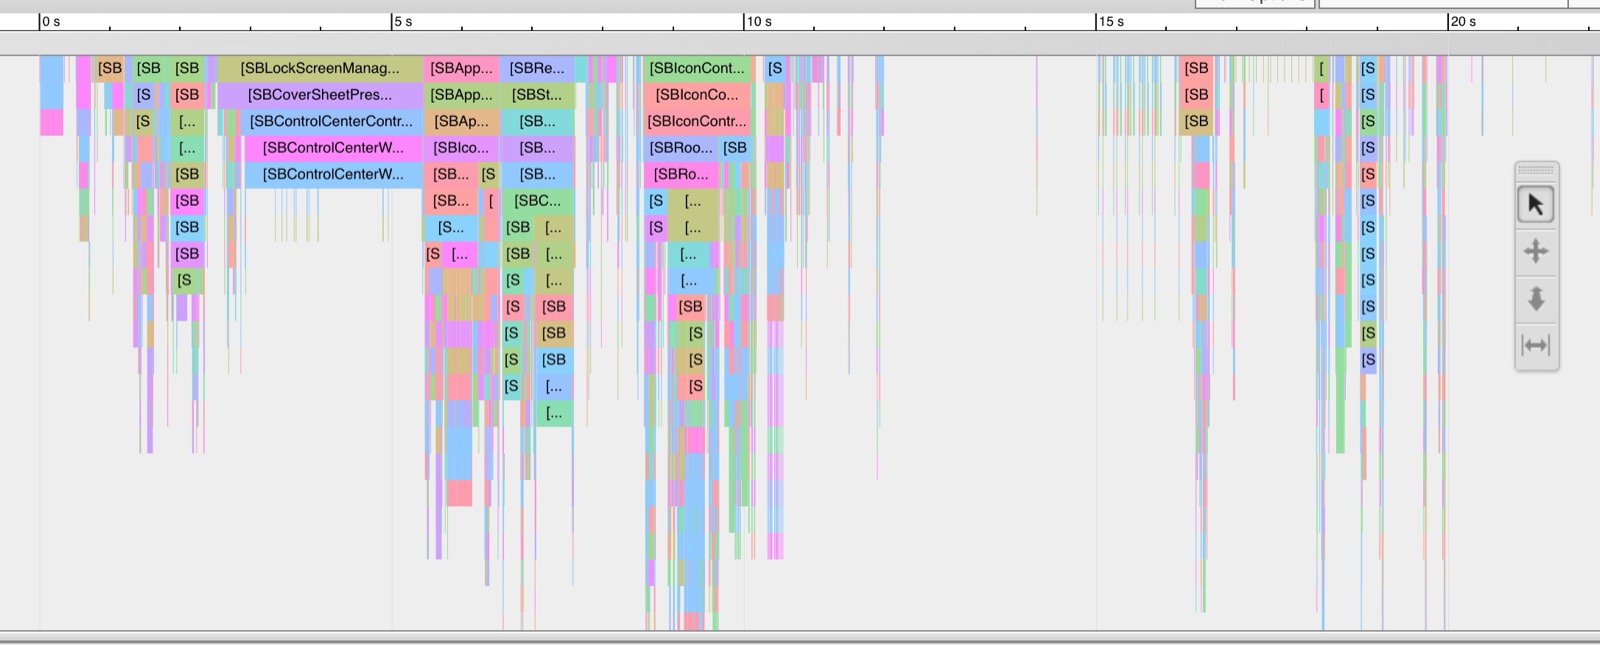
Open chrome://tracing in Chrome, and drag in trace.json.
What Else
Because the current code (tries to) actively filter out some methods from “executables other than the current one”, what you mostly see right now are classes starting with SB.
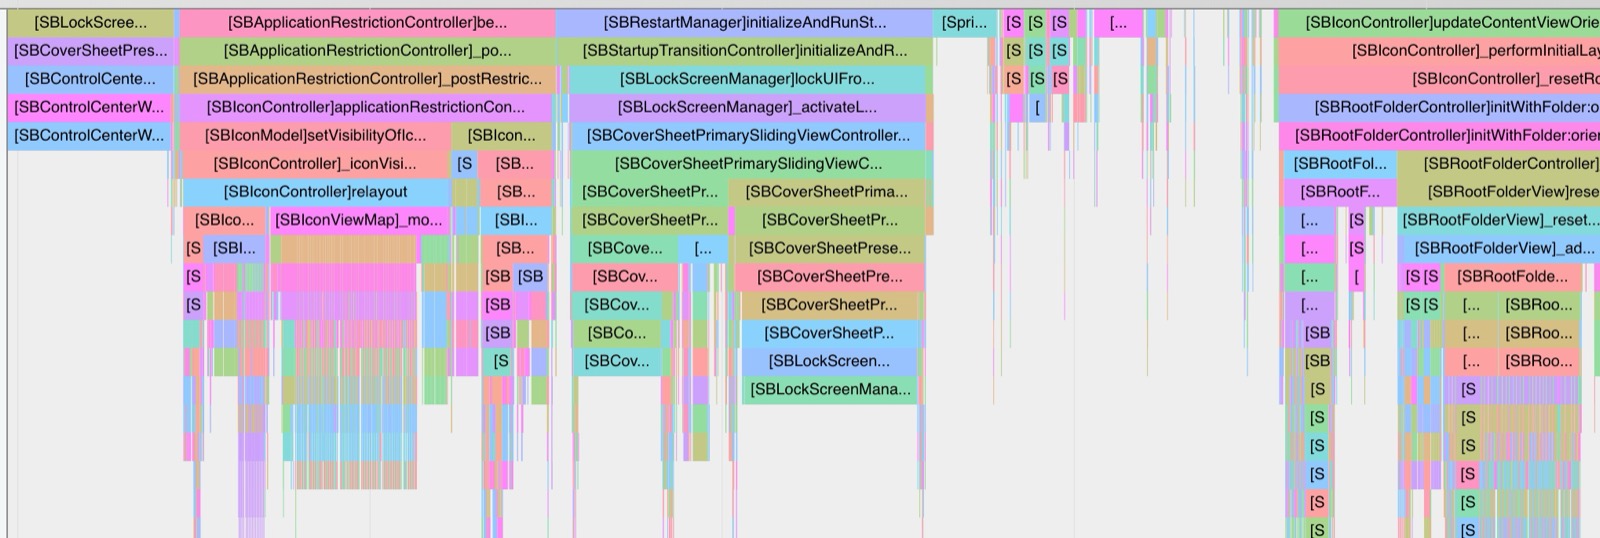
Really a screen full of SB :) Very refreshing
The next step could be to broaden the scope, filtering nothing or filtering less. For the specific code, see:
The trace.json for the SpringBoard above can be found at: https://github.com/everettjf/Yolo/tree/master/BukuzaoArchive/stuff/appletracedata.tar.gz
Other Apps
If we can trace SpringBoard, of course we can trace other apps too. You can refer to past articles on how to trace any app.
Summary
This article is very short — mainly to widely advertise that AppleTrace is also an exploration tool, and it’s quite interesting.
前段时间的《初步探索LaunchScreen》使用IDA和lldb探索了下部分SpringBoard。这篇文章再用AppleTrace初步探索下SpringBoard。AppleTrace 目前使用了HookZz来inline hook objc_msgSend。可用于分析每个Objective C的方法耗时,和调用关系。
背景
AppleTrace 是大概去年(2017年)9月份业余时间开发(或者叫组装)的一个“性能”分析工具。“性能”是加了引号,因为本意是想用来分析性能,但由于对性能影响较大,结果只能拿来参考。或者说可以拿来分析方法之间的相对耗时。
以前写过三篇文章:
- AppleTrace 性能分析工具: https://xnu.app/2017/09/21/appletrace/
- AppleTrace 搭配 MonkeyDev Trace任意App : https://xnu.app/2017/10/12/appletrace-dancewith-monkeydev/
- 使用 Cydia 安装 AppleTrace Tweak : https://xnu.app/2018/07/10/appletrace-tweak-cydia-repo/
哇,竟然写过三篇文章,AppleTrace真能凑数呀
前段时间的《初步探索LaunchScreen》使用IDA和lldb探索了下部分SpringBoard。这篇文章十分简单的介绍下怎么用AppleTrace探索SpringBoard。
地址是: https://github.com/everettjf/AppleTrace 。
当然写这篇文章的原由是因为,AppleTrace一直把catapult和hookzz当作submodule,但因为catapult仓库太大,导致初次下载以及切换分支时等待时间太长;hookzz的接口变动又太频繁,每次更新hookzz都要改代码。于是今天把这两个submodule删除了,找了一个可用的hookzz代码,把代码直接放进了仓库。
怎么做
1、使用MonkeyDev创建Tweak项目(例如CaptainHookTweak)
2、把AppleTrace的objc_msgSend hook相关的文件拖入
3、 配置IP地址后,cmd+r就可以安装到越狱的手机上了。
4、 SpringBoard重启后就会自动记录所有Objective C的方法调用了。
5、 打开目录 /var/mobile/Library/appletracedata,由于SpringBoard的权限特殊性,获取Library目录的位置到了这里。
6、 复制出这些文件。
复制的方法很多。例如可以tar -zcvf x.tar.gz appletracedata/然后scp出来。
7、 使用AppleTrace的merge.py脚本处理成trace.json文件。
Chrome浏览器打开chrome://tracing,把trace.json拖入即可。
还有什么
由于目前的代码会(尝试)主动过滤一些“非当前可执行文件”的方法,目前看到基本都是SB开头的类。
真实满屏幕的SB啊 :) 很提神
下一步可以扩大范围,不过滤或者少过滤。具体代码可见:
上面SpringBoard的trace.json见:https://github.com/everettjf/Yolo/tree/master/BukuzaoArchive/stuff/appletracedata.tar.gz
其他App
SpringBoard我们能Trace,其他App更是可以了。可以参考过去的文章,如何Trace任意App。
总结
这篇文章很简短,主要广而告之下AppleTrace也是一个探索的工具,很有意思。