writing
AppleTrace: A Performance Analysis ToolAppleTrace 性能分析工具
· Building tools & products
Translated from Chinese — .
On this page
(Related article: https://xnu.app/2017/10/12/appletrace-dancewith-monkeydev/ )
Background
In general, using Instruments (mainly Time Profiler) for iOS App performance analysis is enough, but Time Profiler merges the called methods together, losing the temporal representation. Then one day I saw an Android-developer colleague using systrace for performance analysis. systrace generates an html file that shows the time cost of function (method) calls in chronological order. I thought to myself: it’d be great if iOS had a tool like this. I learned that this html file is generated by catapult.
One day I saw a post on the iosre forum about hooking objc_msgSend. It suddenly occurred to me that I could combine this with catapult to generate a performance analysis chart of Objective-C methods (let’s call it that for now). (Although there had always been ways to hook objc_msgSend, this time I finally couldn’t resist digging into this prepared delicacy.)
No sooner said than done—I paused development of MachOExplorer for a few days. Lately I’d been developing MachOExplorer at a snail’s pace using my scant spare time, but now it seems generating a performance analysis chart is more important. Thinking back to some of the grueling overtime in the past—if I could have generated this performance analysis chart, wouldn’t I have solved the problem much faster back then?
Goal
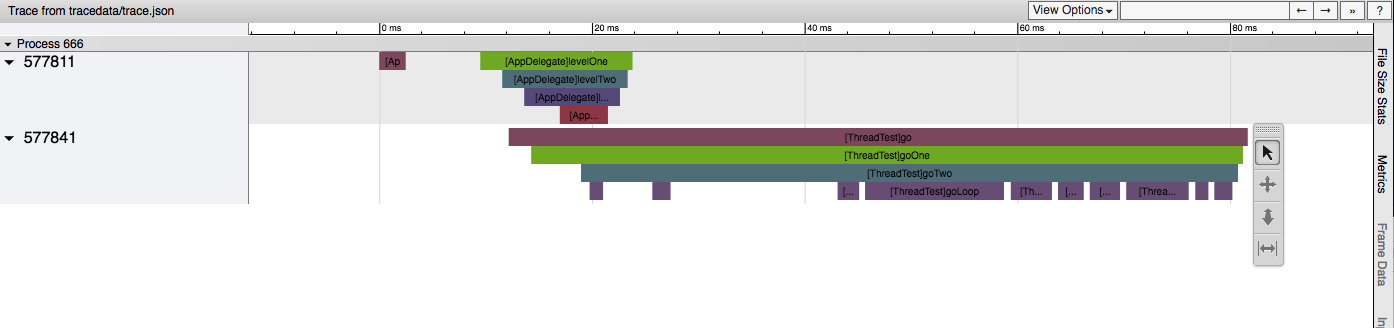
Hook all objc_msgSend, i.e., calculate the time cost of each Objective-C method, and generate a performance analysis chart in chronological order.
Problems to Solve
How to Generate the Final html
From here you can learn how catapult generates html. One of the ways is: Chrome’s trace_event format. Simply put, trace_event format is a json format; after filling in data according to this agreed-upon json format, you can use the trace2html command (a python script) to convert it into the final html file.
$CATAPULT/tracing/bin/trace2html my_trace.json --output=my_trace.html && open my_trace.html
How to Hook objc_msgSend
See the article Quickly Reverse with HookZz (Hack objc_msgSend) to Clarify the Logic
HookZz is a tiny hook framework developed by jmpews, and it’s very flexible to use. See https://jmpews.github.io/zzpp/ for details.
How to Generate the trace_event format json File
Referring to the doc Chrome’s trace_event format, you can learn that the simplest json file can look like this:
[ {"name": "Asub", "cat": "PERF", "ph": "B", "pid": 22630, "tid": 22630, "ts": 829},
  {"name": "Asub", "cat": "PERF", "ph": "E", "pid": 22630, "tid": 22630, "ts": 833} ]
Each line represents an Event,
{
  "name": "myName",
  "cat": "category,list",
  "ph": "B",
  "ts": 12345,
  "pid": 123,
  "tid": 456,
  "args": {
    "someArg": 1,
    "anotherArg": {
      "value": "my value"
    }
  }
}
The meaning of each field is as follows:
- name: The name of the event, as displayed in Trace Viewer
- cat: The event categories. This is a comma separated list of categories for the event. The categories can be used to hide events in the Trace Viewer UI.
- ph: The event type. This is a single character which changes depending on the type of event being output. The valid values are listed in the table below. We will discuss each phase type below.
- ts: The tracing clock timestamp of the event. The timestamps are provided at microsecond granularity.
- tts: Optional. The thread clock timestamp of the event. The timestamps are provided at microsecond granularity.
- pid: The process ID for the process that output this event.
- tid: The thread ID for the thread that output this event.
- args: Any arguments provided for the event. Some of the event types have required argument fields, otherwise, you can put any information you wish in here. The arguments are displayed in Trace Viewer when you view an event in the analysis section.
Among them, ph (event type) is the one to care about:
| Event type | Event phases |
|---|---|
| Duration Events | B(begin), E(end) |
| … | … |
That is to say, a method call has at least two lines, ph=B and ph=E.
Once the format is clear, we need to generate the json file. Generating this json file is essentially a logging feature; to affect the App’s performance as little as possible, the memory-mapped mmap method is used to write the file. At the same time, to handle multithreading simply, a serial queue is used. See the code here
The final trace file is generated in the Library/appletracedata directory of the App’s sandbox. Since the log volume can be huge, and combined with the characteristics of mmap, log files are generated with the following logic:
trace.appletrace
trace_1.appletrace
trace_2.appletrace
trace_3.appletrace
...
trace_N.appletrace
Each appletrace file is 16MB; due to the characteristics of mmap (it can only map a fixed-size file), the end of a file is generally padded with \0.
After generating these appletrace files, you need to copy them out of the App’s sandbox. Use merge.py to convert the appletrace files into a trace_event format json file.
python merge.py -d <appletracedata directory>
Finally, run catapult’s trace2html script to generate the final html file.
python catapult/tracing/bin/trace2html appletracedata/trace.json --output=appletracedata/trace.html
Source Code
https://github.com/everettjf/AppleTrace
Usage
Collecting Data
Currently there are two ways to collect data.
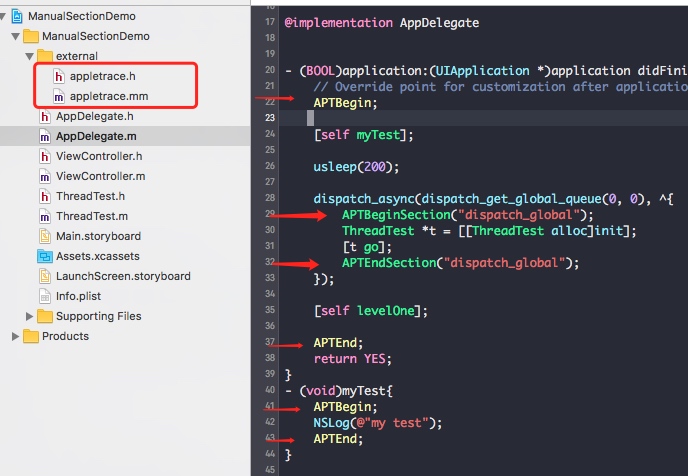
Manual APTBeginSection and APTEndSection
This scenario is: I don’t want to hook all Objective-C methods; I just want to manually add start points and end points bit by bit when analyzing performance. (Android’s systrace supports this too.) Although tedious, this is more refined and accurate after narrowing down the general direction, and avoids the impact of hooking on the App’s own performance.
(1) You just need to drag the appletrace.h and appletrace.mm files into your own feature. (Of course, this could be made into a CocoaPods—I’ll do that when I have time.)
(2) Then, at the beginning and end of a function (method) (or any interval you’re interested in), call APTBeginSection and APTEndSection. For Objective-C methods you can use the macros APTBegin and APTEnd.
// Objective C class method
#define APTBegin APTBeginSection([NSString stringWithFormat:@"[%@]%@",self,NSStringFromSelector(_cmd)].UTF8String)
#define APTEnd APTEndSection([NSString stringWithFormat:@"[%@]%@",self,NSStringFromSelector(_cmd)].UTF8String)
See the example sample/ManualSectionDemo.
Hook objc_msgSend
This scenario is: I want to get an initial sense of where the time-consuming operations are; I can hook objc_msgSend once overall, to get a rough understanding of the whole App’s flow.
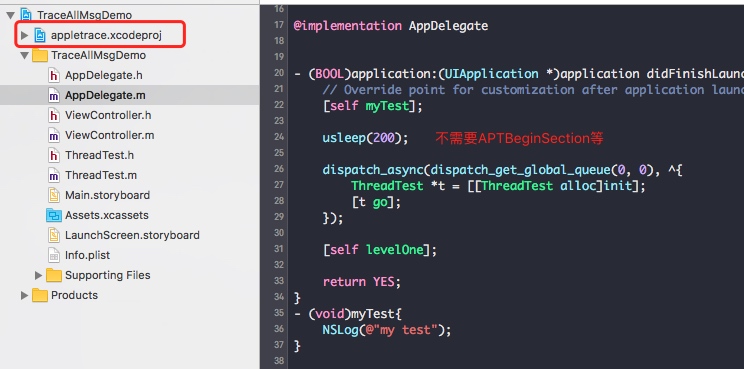
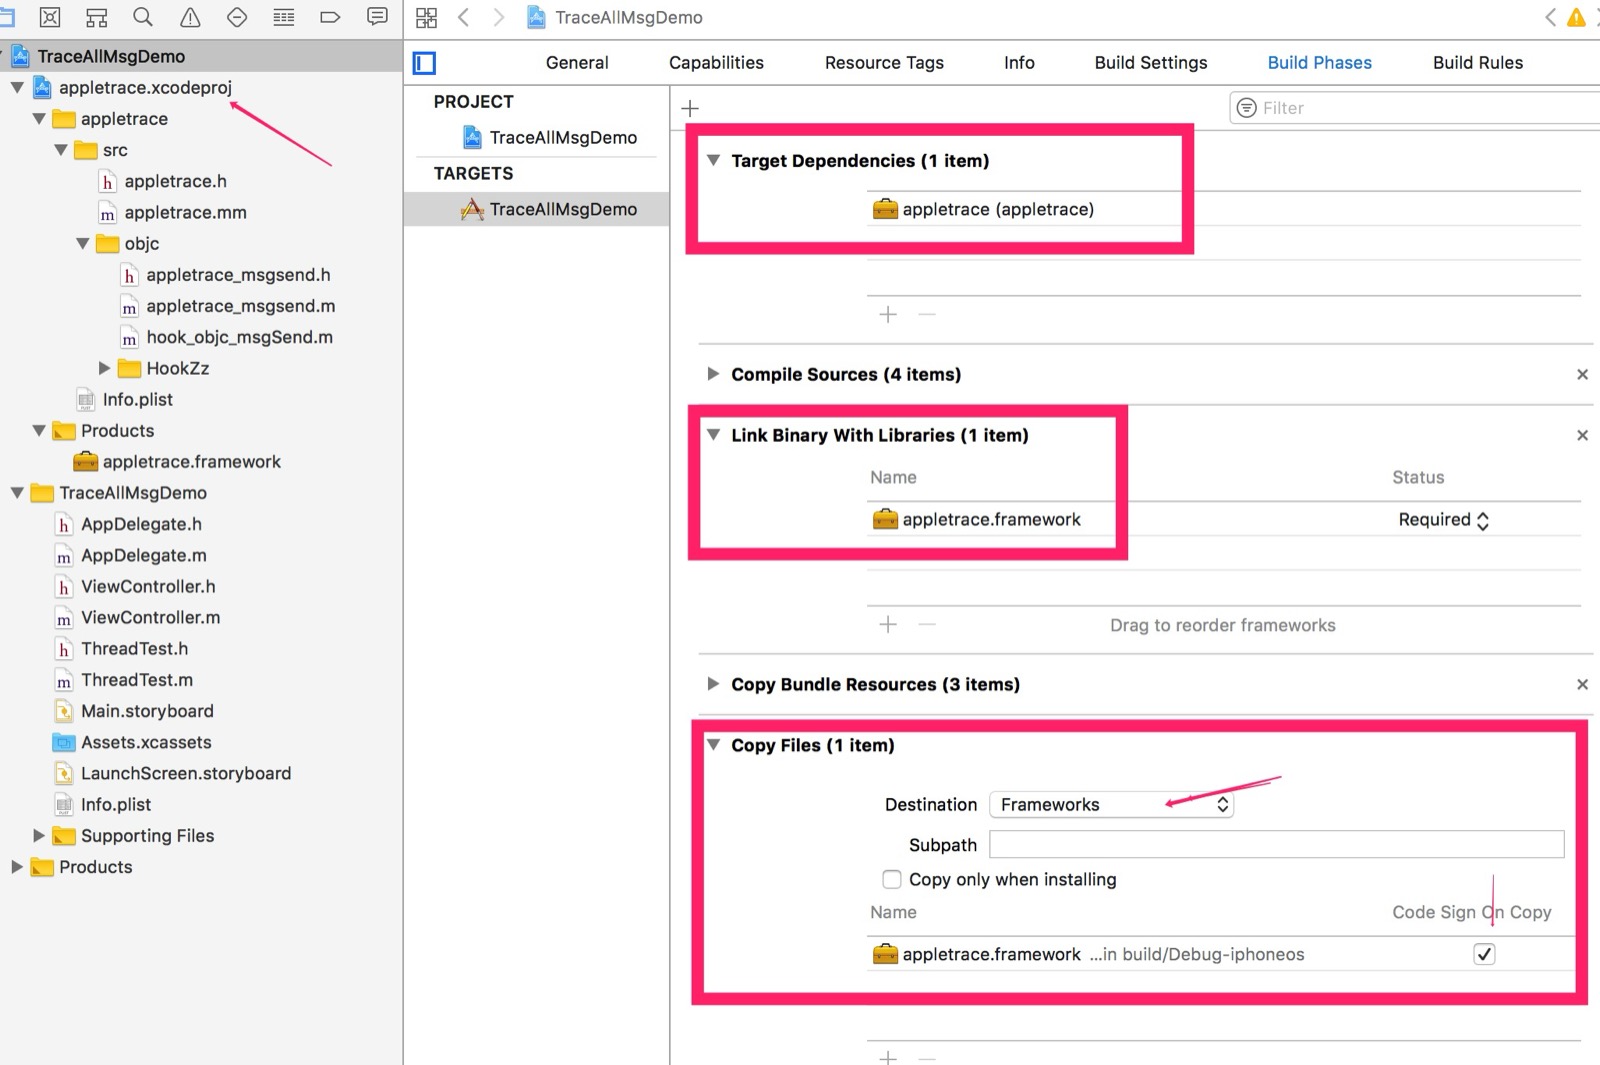
(1) Drag the dynamic library project appletrace.xcodeproj into the target project.
(2) And configure the dynamic library’s Target Dependencies and Copy Files.
See sample/TraceAllMsgDemo.
Note:
- You need to disable BitCode.
- Only arm64 is supported.
Process the Data and Generate html
Copy the Library/appletracedata directory out of the App’s sandbox. (For example: Xcode can directly dump the entire sandbox.)

Then,
// 处理mmap的日志文件
python merge.py -d <appletracedata directory>

// 生成html
python catapult/tracing/bin/trace2html appletracedata/trace.json --output=appletracedata/trace.html

// 打开
open trace.html
And you’ll see
Performance Impact
The current impact on App performance is mainly:
- Hooking objc_msgSend: this is the main impact, so the final result generated is only for analysis and comparison, and should not be considered as the actual time these values cost.
- Log files: to write logs, files are mmap’d and a queue is created. This also affects the App’s own performance.
Limitations
Since HookZz’s hook of objc_msgSend is only implemented for the arm64 architecture, you can only analyze on real devices. (Of course, this is enough—mainstream devices are arm64.)
Plans
Plan 1: dtrace
For the source of data generation, there are currently two:
- Manual APTBeginSection and APTEndSection
- Hook objc_msgSend
I’ve also been studying dtrace for a while recently—it’s entirely possible to use dtrace to generate data for the simulator. Since dtrace is at the kernel level, its impact on the App’s own performance is very small, and dtrace can not only hook (trace) Objective-C methods, but also trace C methods and swift methods. This is the next step in the plan.
Plan 2: Whitelist Classes / Blacklist Classes
For the objc_msgSend hooking approach, some classes may not be of interest. We can use whitelist or blacklist approaches to narrow the scope of analysis.
Plan 3: Hook +load and C++ static initializers
See A method of hook static initializers and A method of hook objective c +load
Summary
This tool itself doesn’t have much code (writing logs); it mainly combines catapult and HookZz. Thanks again to catapult and HookZz.
If you have any questions, feel free to open an issue anytime, or contact my WeChat everettjf.
文章目录
(关联文章:https://xnu.app/2017/10/12/appletrace-dancewith-monkeydev/ )
背景
一般情况下使用Instruments(主要是Time Profiler)进行iOS App的性能分析就足够了,但是Time Profiler 把调用方法都合并了起来,失去了时序的表现。直到有一天看到Android开发的同事使用 systrace 分析性能,systrace生成一个html文件,把函数(方法)的调用耗时按照先后顺序表现出来。心里想:要是iOS也有这样的工具就好了。了解到这个html文件是 catapult 生成的。
一天看到iosre论坛一篇hook objc_msgSend的帖子。突然想到,可以结合catapult来生成Objective C方法的性能分析图(暂且这么叫吧)。(虽然一直也有hook objc_msgSend的方法,但这次煮好的佳肴终于忍不住下手了)。
说搞就开始搞,暂停几天开发MachOExplorer。近期一直利用少之又少的业余时间蜗牛般开发MachOExplorer,但现在看来生成性能分析图更是重要,回想过去的一些苦力加班,如果能生成这个性能分析图,当时岂不是很快就解决问题了。
目标
hook 所有的objc_msgSend,也就是把每个Objective C方法的耗时计算出来,并按照先后顺序生成性能分析图。
要解决的问题
如何生成最终的html
从这里可以了解到catapult是如何生成html的。其中一种方式可以是:Chrome’s trace_event format。简单来说,trace_event format 就是个json格式,按照这个约定的json格式填充数据后,就可以使用trace2html命令(python脚本)转换为最终的html文件了。
$CATAPULT/tracing/bin/trace2html my_trace.json --output=my_trace.html && open my_trace.html
如何Hook objc_msgSend
见文章使用HookZz快速逆向(Hack objc_msgSend) 理清逻辑
HookZz是jmpews开发的微型hook框架,使用起来十分灵活。详见 https://jmpews.github.io/zzpp/
如何生成trace_event format的json文件
参考文档 Chrome’s trace_event format 可以了解到,最简单的json文件,可以是这样:
[ {"name": "Asub", "cat": "PERF", "ph": "B", "pid": 22630, "tid": 22630, "ts": 829},
  {"name": "Asub", "cat": "PERF", "ph": "E", "pid": 22630, "tid": 22630, "ts": 833} ]
每一行表示一个Event,
{
  "name": "myName",
  "cat": "category,list",
  "ph": "B",
  "ts": 12345,
  "pid": 123,
  "tid": 456,
  "args": {
    "someArg": 1,
    "anotherArg": {
      "value": "my value"
    }
  }
}
每个字段的含义如下:
- name: The name of the event, as displayed in Trace Viewer
- cat: The event categories. This is a comma separated list of categories for the event. The categories can be used to hide events in the Trace Viewer UI.
- ph: The event type. This is a single character which changes depending on the type of event being output. The valid values are listed in the table below. We will discuss each phase type below.
- ts: The tracing clock timestamp of the event. The timestamps are provided at microsecond granularity.
- tts: Optional. The thread clock timestamp of the event. The timestamps are provided at microsecond granularity.
- pid: The process ID for the process that output this event.
- tid: The thread ID for the thread that output this event.
- args: Any arguments provided for the event. Some of the event types have required argument fields, otherwise, you can put any information you wish in here. The arguments are displayed in Trace Viewer when you view an event in the analysis section.
其中ph(event type)是需要关心的:
| Event type | Event phases |
|---|---|
| Duration Events | B(begin), E(end) |
| … | … |
也就是说一个方法的调用,至少有两行,ph=B和ph=E。
格式弄清楚后,就需要生成json文件了。生成这个json文件本质上就是个日志功能,为了尽最大可能不影响App的性能,使用内存映射mmap方法来写文件。同时为了简单的处理多线程问题,使用了串行queue。代码见这里
最终trace文件会生成在App沙盒中的Library/appletracedata目录。由于日志量可能很大,又结合mmap的特性,日志文件会以下面的逻辑生成:
trace.appletrace
trace_1.appletrace
trace_2.appletrace
trace_3.appletrace
...
trace_N.appletrace
每个appletrace文件16MB,由于mmap的特性(只能映射固定大小文件),文件末尾一般会有\0来填充。
生成这些appletrace文件后,需要从App的沙盒中复制出来。使用merge.py把appletrace文件转换为trace_event format的json文件。
python merge.py -d <appletracedata directory>
最终执行catapult的trace2html脚本,生成最终的html文件。
python catapult/tracing/bin/trace2html appletracedata/trace.json --output=appletracedata/trace.html
源码
https://github.com/everettjf/AppleTrace
使用方法
采集数据
目前有两种采集数据的方式。
手动 APTBeginSection 和 APTEndSection
这种场景是:我不想hook所有的Objective C方法,我只想在分析性能时,一点一点手动添加开始点和结束点。(这点Android的systrace也是支持)虽然麻烦,但在定位到大体方向后,这样更加精细和准确,避免了hook对App本身性能的影响。
(1)只需要把 appletrace.h和appletrace.mm文件拖入自己的功能即可。(当然这里可以做成CocoaPods,有时间可以做下)。
(2)然后在函数(方法)的开头和结尾(或者自己感兴趣的区间),调用APTBeginSection 和 APTEndSection即可。对于ObjectiveC方法可以使用宏APTBegin和APTEnd。
// Objective C class method
#define APTBegin APTBeginSection([NSString stringWithFormat:@"[%@]%@",self,NSStringFromSelector(_cmd)].UTF8String)
#define APTEnd APTEndSection([NSString stringWithFormat:@"[%@]%@",self,NSStringFromSelector(_cmd)].UTF8String)
参考例子 sample/ManualSectionDemo。
Hook objc_msgSend
这种场景是:我想初步定为哪里有耗时的操作,可以整体上Hook objc_msgSend一次,对整个App的流程有个大致了解。
(1)把动态库的工程appletrace.xcodeproj拖拽到目标工程。
(2)并配置动态库的依赖 Target Dependencies 和 Copy Files。
参考 sample/TraceAllMsgDemo。
注意:
- 需要关闭BitCode。
- 仅支持arm64。
处理数据,生成html
从App的沙盒中复制出 Library/appletracedata 目录。(例如:Xcode可以直接Dump出整个沙盒)
然后,
// 处理mmap的日志文件
python merge.py -d <appletracedata directory>

// 生成html
python catapult/tracing/bin/trace2html appletracedata/trace.json --output=appletracedata/trace.html

// 打开
open trace.html
就可以看到
性能影响
目前对App性能的影响主要是:
- Hook objc_msgSend :这个是主要的影响,因此生成的最终结果仅用于分析、对比,而不能认为就是耗费了这些数值。
- 日志文件:为了写日志,mmap了文件,还创建了队列。对App本身的性能也有影响。
局限
由于HookZz对objc_msgSend的hook仅实现了arm64架构,因此只能在真机上分析。(当然这也足够了,主流设备就是arm64)
计划
计划1:dtrace
对于数据的产生来源,目前有两种:
- 手动 APTBeginSection 和 APTEndSection
- Hook objc_msgSend
最近一段时间对 dtrace也学习了一段时间了,完全可以针对模拟器使用dtrace来生成数据。dtrace由于是内核层,对App本身的性能影响很小,而且dtrace不仅仅可以hook(trace)ObjectiveC方法,还可以trace C方法、swift方法。这是下一步的计划。
计划2:白名单类/黑名单类
Hook objc_msgSend的方法,有的类可能并不关心。可以采用白名单或者黑名单的方式,缩小分析范围。
计划3:Hook +load and C++ static initializers
见A method of hook static initializers 和A method of hook objective c +load
总结
这个工具本身的代码不多(写日志),主要是组合了catapult和HookZz,再次感谢catapult和HookZz。
有任何问题欢迎随时 issue,或者联系我的微信 everettjf。