writing
LLDB: How to Set a Breakpoint at a Function's returnLLDB:如何在函数 return 处下断点
· Debugging & reverse engineering
Translated from Chinese — .
You have a complex function with lots of lines and many returns inside. Single-stepping through it is slow — how can you quickly find which line it returns from?
For example, this code:
void foo() {
    int i = arc4random() %100;

    if (i > 30) {
        if (i < 40) {
            return;
        }
        if (i > 77) {
            return;
        }
        if (i < 66) {
            return;
        }
    }

    switch (i) {
        case 0:
            return;
        case 1:
            return;
        case 2:
            return;
        case 3:
            return;
        case 4:
            return;
        default:
            return;
    }
}

int main(int argc, const char * argv[]) {
    foo();
    return 0;
}
Suppose foo is a very long, very complex function with many returns. How do you know which line it returned from?
You can use an lldb breakpoint:
breakpoint set -p return
或者
br set -p return
First add a breakpoint on the first line of foo.
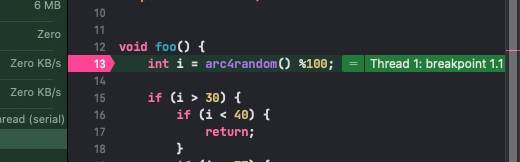
Once the breakpoint triggers, type br set -p return in the console.
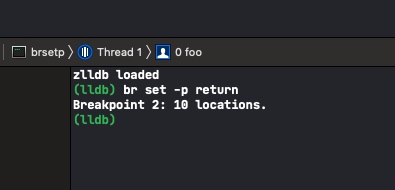
Then continue, and it will break at the line where the function returns.
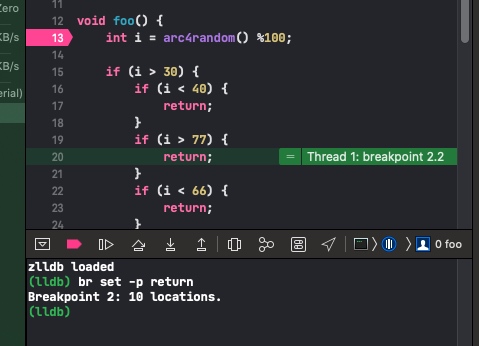
Pretty interesting~
有一个代码行很多的复杂函数,内部有很多return,单步调试很慢,如何快速找到哪一行return了?
例如代码:
void foo() {
    int i = arc4random() %100;

    if (i > 30) {
        if (i < 40) {
            return;
        }
        if (i > 77) {
            return;
        }
        if (i < 66) {
            return;
        }
    }

    switch (i) {
        case 0:
            return;
        case 1:
            return;
        case 2:
            return;
        case 3:
            return;
        case 4:
            return;
        default:
            return;
    }
}

int main(int argc, const char * argv[]) {
    foo();
    return 0;
}
假设foo是个很长很复杂有很多return的函数,如何知道是通过哪一行return的呢?
可以使用lldb的断点
breakpoint set -p return
或者
br set -p return
首先在foo第一行加断点
断点触发后,控制台输入 br set -p return
然后continue,就会断点到函数return的那一行了。
很有趣~