writing
Basic Usage of Nanoscope, an Android Method Tracing ToolAndroid 方法跟踪工具 Nanoscope 基础使用
· Debugging & reverse engineering
Translated from Chinese — .
On this page
When optimizing app performance, I’ve always wished for a tool that could accurately record the time spent in the various methods an app executes within a given time window.
For the iOS platform, you can use AppleTrace, developed by everettjf based on HookZz; or, if you work at Meituan, you can use the internal Trace tool Caesium (searchable externally as “Caesium iOS launch time monitoring”).
For the Android platform, it seems there are quite a lot of Trace tools: CPU Profiler, traceview, systrace, nanoscope, and so on.
This article briefly covers the basic usage of Uber’s open-source nanoscope.
Official Introduction
Pros and Cons
Compared with other trace tools, nanoscope is more accurate and has very little impact on app performance. But it requires flashing the device, and currently only supports the single model Nexus 6P.
How to Use
Step One: Install nanoscope
brew tap uber/nanoscope
brew install nanoscope
Step Two: Flash the Device
- Prepare a Nexus 6P phone (about 400 RMB on Taobao)
- Open “Developer Options”
- Allow “USB Debugging”,
- Connect it to the computer.
- Get the command line (or router) onto a scientific (VPN) internet connection.
- Then run the following command.
nanoscope flash
If you’re lucky, it’ll report success directly.
If you’re unlucky like me, then Google based on the error message. Maybe Reference 1 helps here.
Step Three: Use It
After the phone boots up, the usage is very simple — two usages:
nanoscope start
nanoscope start --package=com.example.app
For example, if I want to trace the launch process of my demoapp, whose package id is com.everettjf.hellonanoscope, then I run directly in the macOS command line:
nanoscope start --package=com.everettjf.hellonanoscope
Then open this demo app on the phone, and after the app finishes launching, press Enter, and it’s all done — too simple.

At this point an html will open automatically, containing all kinds of trace information.
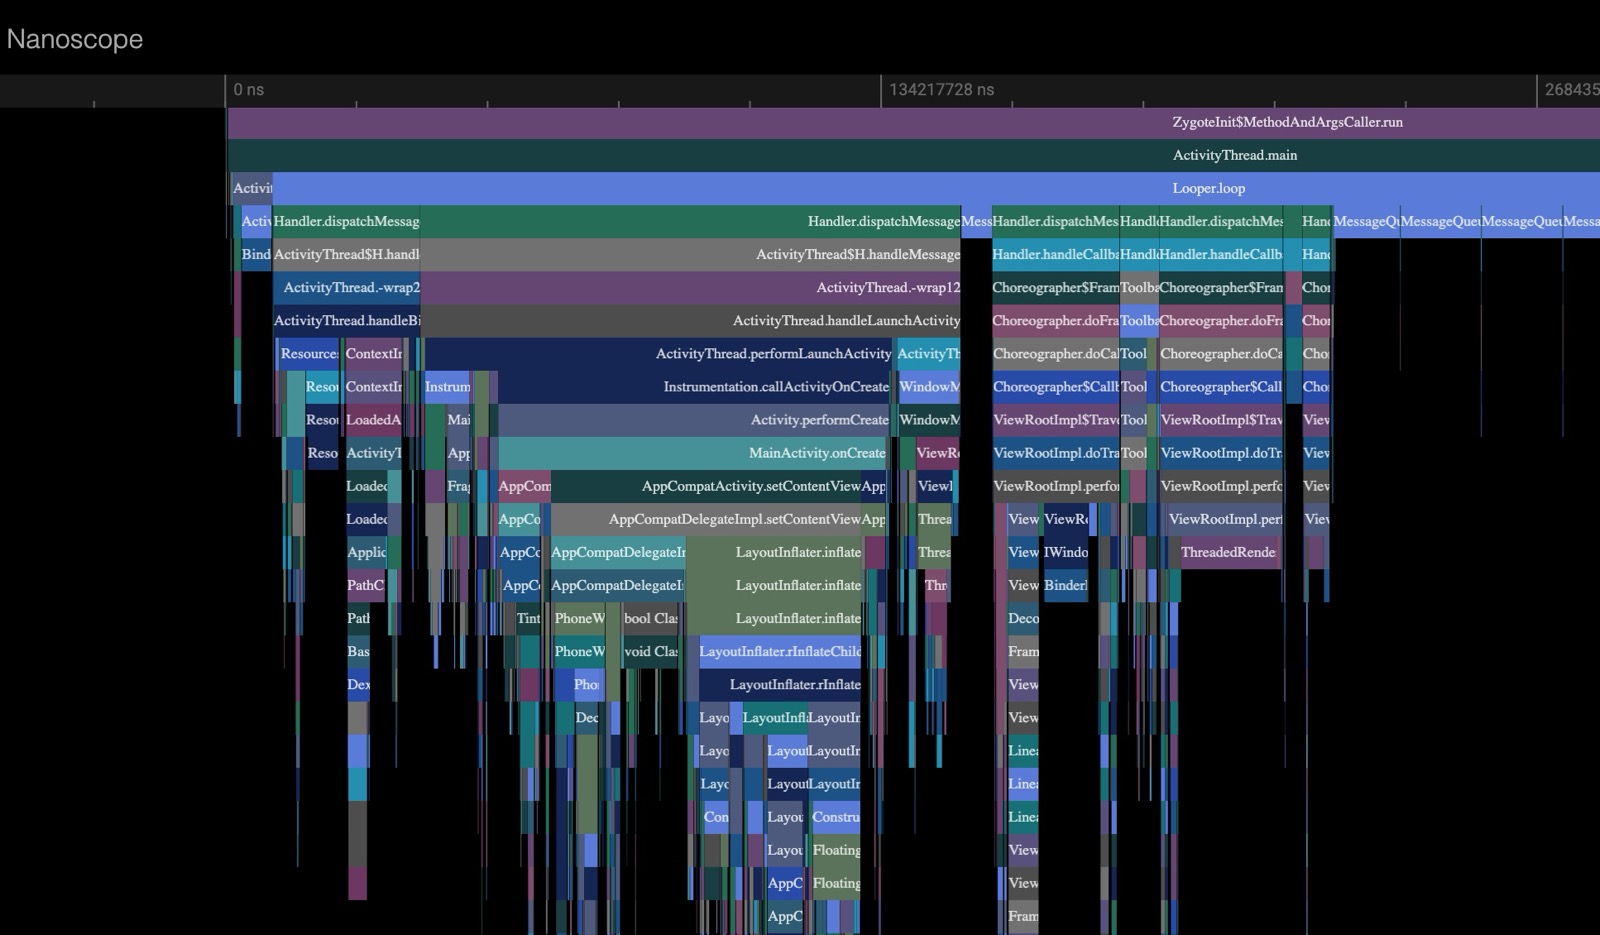
This way you can study an Android app’s launch process — it even includes calls at the system Framework Java level.
Example
Download this file; decompressing it gives you the html above.
You can press the letters w a s d to zoom in/out and view timings.
Summary
Android’s openness has brought a large number of handy “homegrown” tools. Compared with iOS’s hard-to-use Time Profiler, the various R&D auxiliary tools available during Android development are far, far friendlier.
Interesting :)
对App进行性能优化,一直奢望有一个工具,能对指定时间内App执行的各类方法的耗时准确记录下来。
对于iOS平台,可以使用everettjf同学基于HookZz开发的AppleTrace,或者如果你在美团工作,可以使用内部的Trace工具Caesium(外网可搜索“Caesium iOS启动时间监控”)。
对于Android平台,貌似各类Trace工具就比较多了,CPU Profiler、traceview、systrace、nanoscope等等等等。
本文简单讲下Uber开源的nanoscope的基础使用。
官方介绍
优缺点
相比其他trace工具,nanoscope具有精度更准确,对App性能影响十分小的特点。但需要刷机,且目前仅支持Nexus 6P这一个机型。
使用方法
第一步,安装nanoscope
brew tap uber/nanoscope
brew install nanoscope
第二步,刷机
- 准备一个Nexus 6P手机(某宝400RMB)
- 打开“Developer Options”
- 允许”USB Debugging“,
- 连接到电脑。
- 把命令行(或者路由器)scientific上网。
- 然后执行下面的命令。
nanoscope flash
如果运气好,直接提示成功。
如果像我一样运气不好,那根据错误信息Google吧。这里或许有参考1
第三步,使用
手机开机后。用法十分简单,两个用法:
nanoscope start
nanoscope start --package=com.example.app
例如我要trace我的demoapp的启动过程,package id是 com.everettjf.hellonanoscope,那我在macOS命令行直接运行:
nanoscope start --package=com.everettjf.hellonanoscope
然后手机上打开这个demo app,app启动完成后,回车,一切就完成了,太简单了。
此时会自动打开一个html,包含了各种trace信息。
这样就可以学习Android App的启动过程了,这里甚至包含系统Framework Java层面的调用内容。
示例
下载这个文件,解析就是上文的html。
可以按字母 w a s d,放大缩小查看耗时。
总结
Android的开源,带来了大量“民间”的好用工具。相比iOS那难用的Time Profiler,Android在开发中的各类研发辅助工具,友好太多太多。
有趣 :)