writing
A First Look at the os_signpost APIos_signpost API 尝鲜
· Performance & internals
Translated from Chinese — .
On this page
The os_signpost API is a lightweight code performance analysis tool added in iOS 12. It can collect data and visualize it. In Apple’s own words: The os_signpost APIs let clients add lightweight instrumentation to code for collection and visualization by performance analysis tooling.
Background
For performance analysis at the code level, the most intuitive approach is to mark the start and end of a section of code, then compute the elapsed time. Like this:
    CFTimeInterval begin = CACurrentMediaTime();
    // do something
    CFTimeInterval end = CACurrentMediaTime();
    NSLog(@"cost = %@",(end - begin));
However, if the code logic is complex, has ordering dependencies, or involves multiple threads, marking just a small section of code isn’t so intuitive.
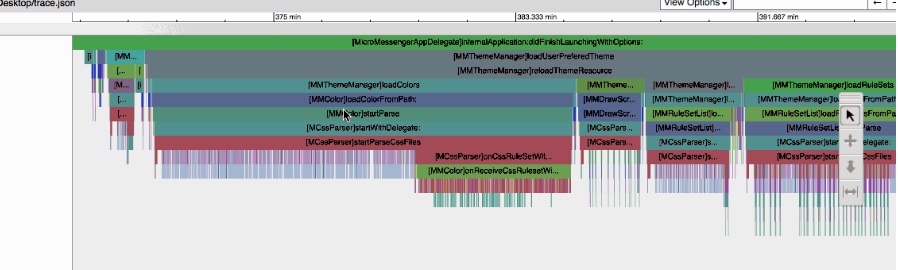
This is exactly why the tool AppleTrace (https://github.com/everettjf/AppleTrace) was created — or catapult (https://github.com/catapult-project/catapult), or the chrome://tracing feature built into Chrome. The image below is an example of AppleTrace.
Starting from iOS 12, the Apple team, paying more attention to performance, also recognized the importance of intuitive visualization (for a better experience) and developed the os_signpost API. I first learned about this API from WWDC: Measuring Performance Using Logging https://developer.apple.com/videos/play/wwdc2018/405, which is recommended viewing. The os_signpost API works together with Instruments to show visualized results.
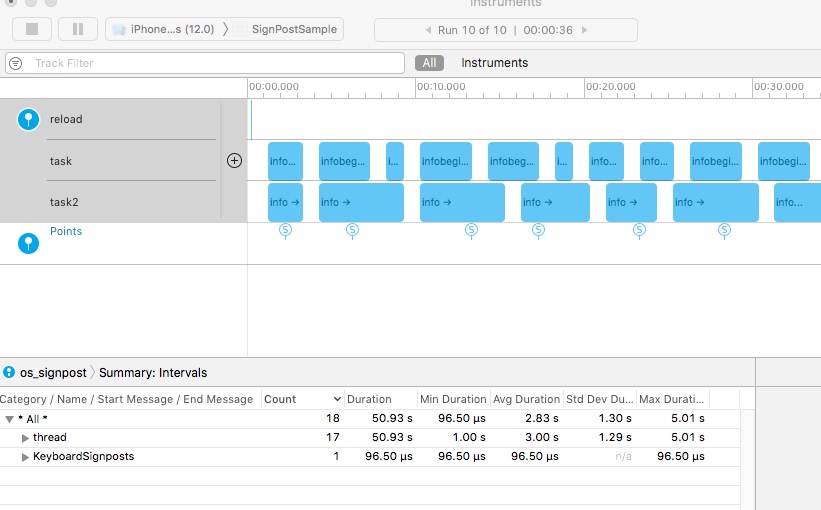
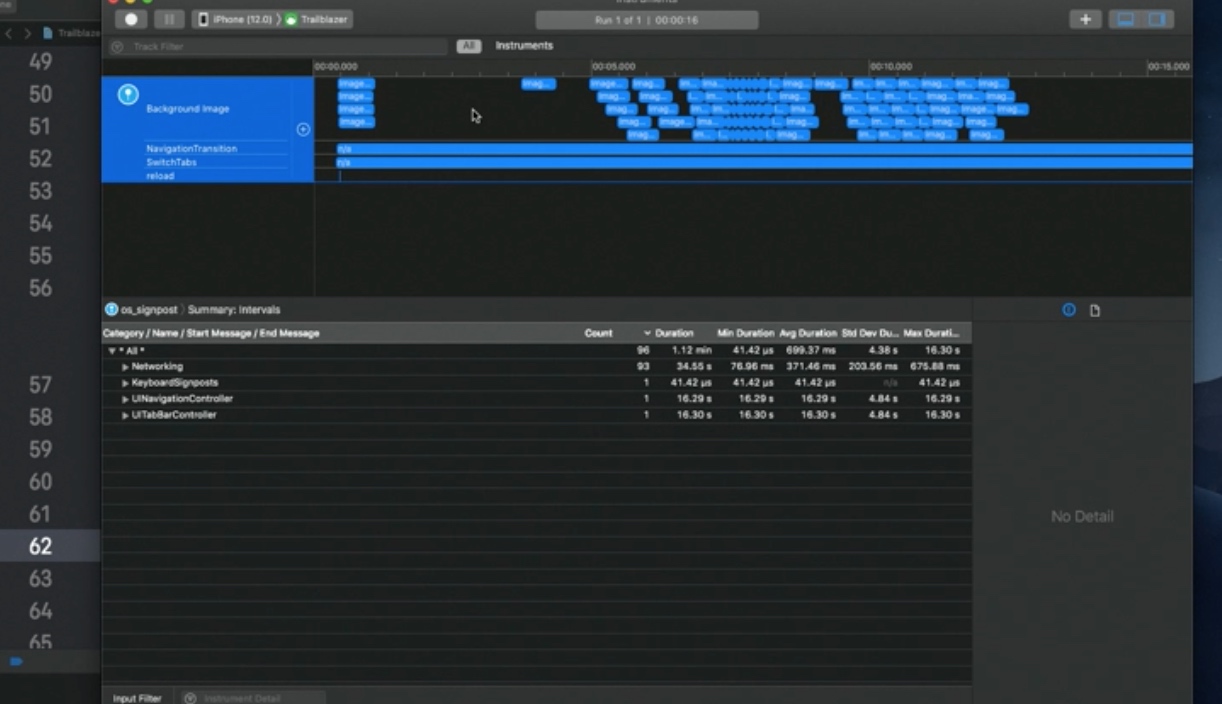
Below is a quick first look; in the end you’ll be able to see something like this:
Environment
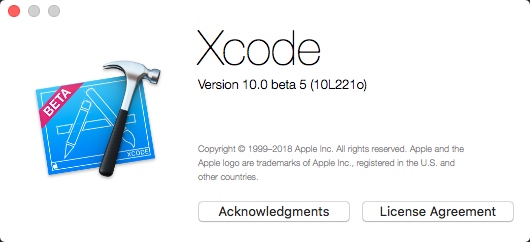
You need the Xcode 10 beta version. As of writing this article, the latest version is:
A First Try
This article only covers the C usage; Swift is similar and the WWDC talk uses Swift.
First include the header:
#include <os/signpost.h>
The code is simple — three steps, as follows:
    // Step one: create a log object
    os_log_t log = os_log_create("com.everettjf.sample.signpost", "hellosignpost");

    // Create an os_signpost ID
    os_signpost_id_t spid = os_signpost_id_generate(log);

    // Mark the start and end
    os_signpost_interval_begin(log, spid, "task");
    doSomethingShort();
    os_signpost_interval_end(log, spid, "task");
Open Instruments and you can choose an empty template.
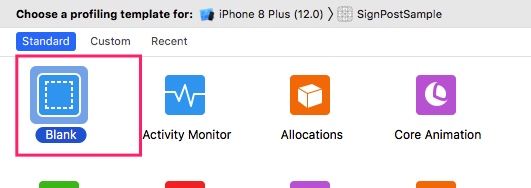
Then click the add button in the top right and find os_signpost.
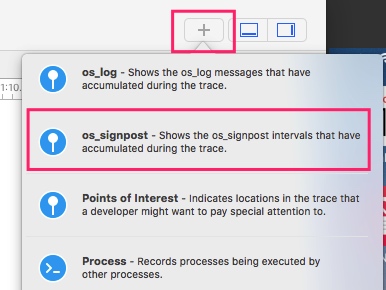
Drag it to the left side,
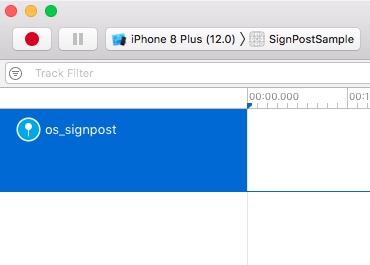
Click the red circle (Start) in the top left and you’ll see the image below.
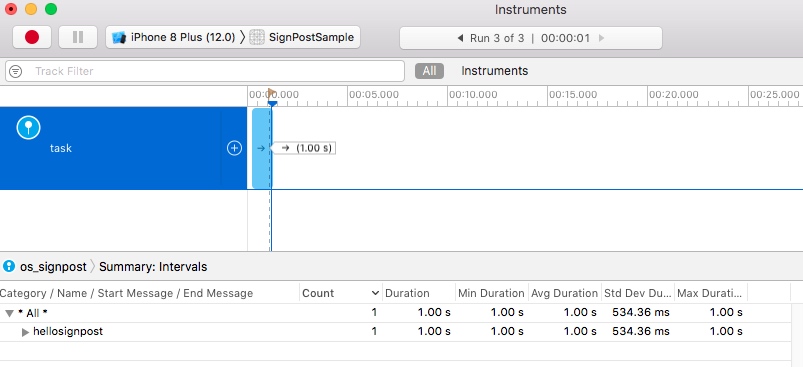
API Explanation
- os_log_create: the first parameter is a reverse DNS format ID, the second is the category (the Category shown below in the image above). You can create different log objects to display different Categories in the image above.
- os_signpost_id_generate: generates an ID. Similar methods are os_signpost_id_make_with_id and os_signpost_id_make_with_pointer, mainly used to identify the matching relationship between a start and an end.
- os_signpost_interval_begin and os_signpost_interval_end: mark the start and end. The third parameter is the name given to this time interval. From the fourth parameter onward, it’s a printf-like format argument.
Another Try
Let’s make it a bit more complex, with this code:
    os_log_t log = os_log_create("com.everettjf.sample.signpost", "thread");
    os_signpost_id_t spid = os_signpost_id_generate(log);

    dispatch_queue_t queue1 = dispatch_queue_create("com.everettjf.test1", DISPATCH_QUEUE_SERIAL);
    dispatch_queue_t queue2 = dispatch_queue_create("com.everettjf.test2", DISPATCH_QUEUE_SERIAL);

    for(int i = 0; i < 10; i++){
        dispatch_async(queue1, ^{
            doSomethingOther();
            os_signpost_interval_begin(log, spid, "task", "infobegin%d", i);
            doSomethingShort();
            os_signpost_interval_end(log, spid, "task","infoend%d",i);
        });

        dispatch_async(queue2, ^{
            doSomethingOther();
            os_signpost_interval_begin(log, spid, "task2","info");
            doSomethingLong();
            os_signpost_interval_end(log, spid, "task2");
        });
    }
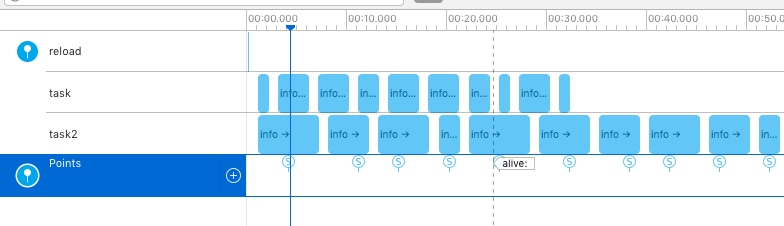
And you can see this.
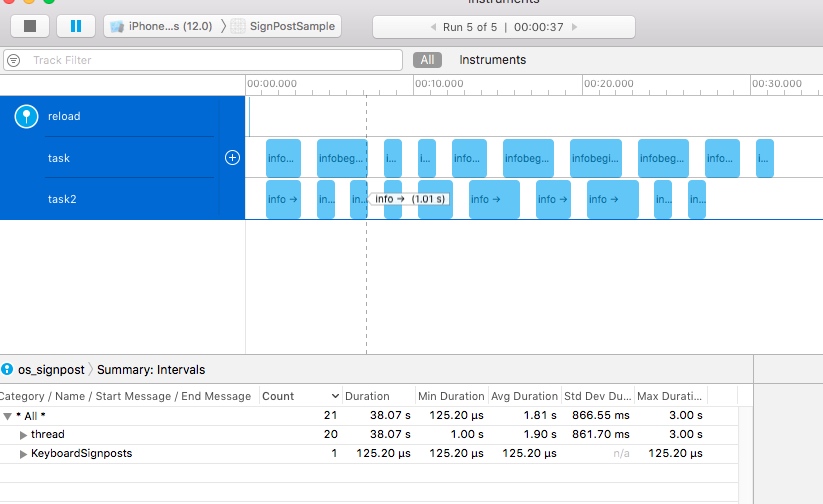
Point Of Interest
You can also add some points of interest:
    os_log_t loginterest = os_log_create("com.everettjf.sample.signpost", OS_LOG_CATEGORY_POINTS_OF_INTEREST);
    os_signpost_id_t spidinterest = os_signpost_id_generate(loginterest);

    //...

    os_signpost_event_emit(loginterest, spidinterest, "alive");
As shown in the Points below.
Code
Reference code: https://github.com/everettjf/Yolo/tree/master/BukuzaoArchive/sample/SignPostSample/SignPostSample/AppDelegate.m
Summary
Just a quick taste to relax — it’s quite fun. The os_signpost API is sure to be a great companion for performance analysts in the future.
With a dark theme in the future, it really looks cool.
os_signpost API 是 iOS12 新增的轻量级代码性能分析工具,可以采集数据并可视化。官方原话是 The os_signpost APIs let clients add lightweight instrumentation to code for collection and visualization by performance analysis tooling.
背景
代码层面的性能分析,最直观的方式就是标识出一段代码的开始和结尾,然后计算下耗时。就像下面这样:
    CFTimeInterval begin = CACurrentMediaTime();
    // do something
    CFTimeInterval end = CACurrentMediaTime();
    NSLog(@"cost = %@",(end - begin));
然而如果代码逻辑复杂、有先后关系、存在多个线程等,单靠某小段代码的标记,就不是那么直观了。
由此也就诞生了 AppleTrace (https://github.com/everettjf/AppleTrace)这个工具,或者说catapult (https://github.com/catapult-project/catapult),或者说Chrome内置的 chrome://tracing 功能。下图是AppleTrace的例子。
iOS12 开始更加关注性能的苹果团队,也发现了直观展示的重要性(体验更好),开发了 os_signpost API。最早接触这个API是从 WWDC:Measuring Performance Using Logging https://developer.apple.com/videos/play/wwdc2018/405 中了解到的,推荐观看。os_signpost API可配合Instruments工具,显示可视化的效果。
下面就简单尝鲜,最终可以看到这样的效果:
环境
需要Xcode10 beta版本,目前写这篇文章时,最新版本是:
尝鲜
这篇文章只介绍C的使用方法,swift类似且WWDC中是以swift语言来讲的。
先包含头文件
#include <os/signpost.h>
代码很简单,三个步骤,如下:
    // 第一步,创建一个log对象
    os_log_t log = os_log_create("com.everettjf.sample.signpost", "hellosignpost");

    // 创建os_signpost的ID
    os_signpost_id_t spid = os_signpost_id_generate(log);

    // 标记开始和结束
    os_signpost_interval_begin(log, spid, "task");
    doSomethingShort();
    os_signpost_interval_end(log, spid, "task");
打开Instruments,可以选择一个空的模板。
然后点击右上角添加,找到os_signpost。
拖拽到左侧,
点击左上角红色的圆点(Start)就可以看到下图啦。
API解释
- os_log_create 第一个参数就是个reverse DNS格式的ID,第二个参数是类别(上图中下面的Category)。可以创建不同的log对象,在上图中展示不同的Category。
- os_signpost_id_generate 产生一个ID。类似的方法有 os_signpost_id_make_with_id 和 os_signpost_id_make_with_pointer,主要是用于标识一个开始和结束的匹配关系。
- os_signpost_interval_begin 和 os_signpost_interval_end 标记开始和结束。第三个参数是给这段时间起的名字。第四个参数开始就是类似printf的格式化参数了。
再尝鲜
下面再复杂一点,用这个代码:
    os_log_t log = os_log_create("com.everettjf.sample.signpost", "thread");
    os_signpost_id_t spid = os_signpost_id_generate(log);

    dispatch_queue_t queue1 = dispatch_queue_create("com.everettjf.test1", DISPATCH_QUEUE_SERIAL);
    dispatch_queue_t queue2 = dispatch_queue_create("com.everettjf.test2", DISPATCH_QUEUE_SERIAL);

    for(int i = 0; i < 10; i++){
        dispatch_async(queue1, ^{
            doSomethingOther();
            os_signpost_interval_begin(log, spid, "task", "infobegin%d", i);
            doSomethingShort();
            os_signpost_interval_end(log, spid, "task","infoend%d",i);
        });

        dispatch_async(queue2, ^{
            doSomethingOther();
            os_signpost_interval_begin(log, spid, "task2","info");
            doSomethingLong();
            os_signpost_interval_end(log, spid, "task2");
        });
    }
就可以看到这样了。
Point Of Interest
还可以添加一些感兴趣的点,
    os_log_t loginterest = os_log_create("com.everettjf.sample.signpost", OS_LOG_CATEGORY_POINTS_OF_INTEREST);
    os_signpost_id_t spidinterest = os_signpost_id_generate(loginterest);

    //...

    os_signpost_event_emit(loginterest, spidinterest, "alive");
如下图Points。
代码
总结
尝尝鲜,放松一下,挺好玩,os_signpost API 未来一定是性能分析者的好伙伴。
未来配上黑色主题,确实很炫。